Today I struggled a bit with pylab's plot_date function and overlapping date tick labels:
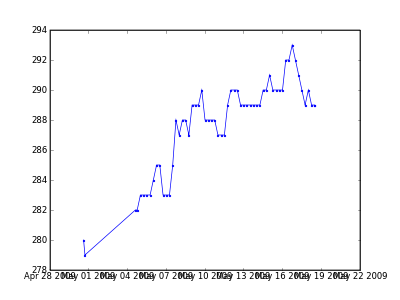
After some googling, I found that matplotlib offers nice flexible date tick control and formatting. I added a date tick locator and a date formatter to the mix as follows:
import pylab
import matplotlib
import matplotlib.dates

fig = pylab.figure()
ax = fig.gca()

# Plotting stuff here ...
ax.plot_date(dates, values, 'b.-')

# Set major x ticks on Mondays.
ax.xaxis.set_major_locator(
    matplotlib.dates.WeekdayLocator(byweekday=matplotlib.dates.MO)
)
ax.xaxis.set_major_formatter(
    matplotlib.dates.DateFormatter('%a %d\n%b %Y')
)
and now I have this plot:
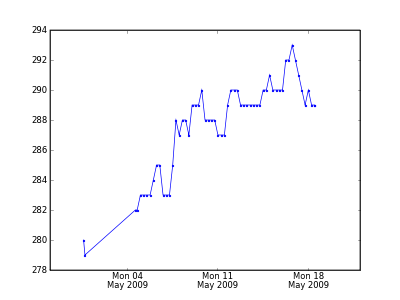
Nice.